.jpg)
Understanding and Interpreting Echoes
Lunar echoes are far from constant in intensity. There's a 28 day cycle as the moon's distance changes during the course of its orbit around the earth. This gives rise to a predictable change in echo strength of around 2.1dB between when the moon is closest (perigee) and when it is furthest away (apogee). The echo follows the radar equation which tells you that the strength of the echo is proportional to the 4th power of the distance.
However there is a stronger and unpredictable factor which changes from echo to echo and this is known as Libration Fading. The moon is rough and spherical. Echoes from different areas on the surface come back at slightly different times and with slightly different phases. Sometimes all these signals will add constructively, giving a stronger echo, other times these signals will add destructively, giving a weaker echo. The variation about the mean value can be up to about +/-6dB, though more usually it's maybe +/- 1 or 2dB.
For a reasonably strong echo, here's a plot of individual echo strength and the integrated average echo strength over the course of 18 echoes. The average echo strength settles down to about -10dB, but there are individual echoes of about +2.1dB and -2.7dB in this sequence.
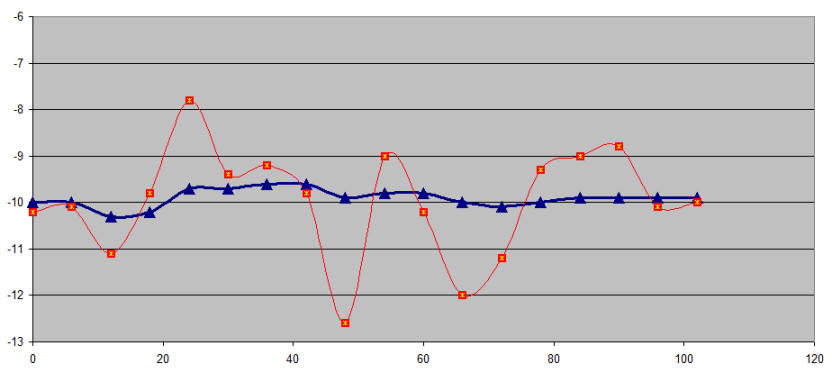
The blue points are the averaged values, the red points are the individual echo values. The X-axis is time in seconds (one echo every 6 seconds) and the Y-axis is the reported SNR (dB in 2500Hz)
This makes it pretty clear why you need to average a series of echoes to get a meaningful SNR numbers. These individual echo measurmements are probably real because it this SNR level it is possible to get a reasonable estimate of the strength of a single echo.
For weaker echoes, the situation is more complex and looks more like this:
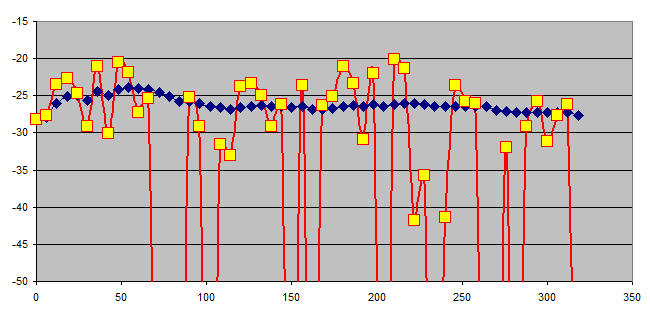
The blue points are the averaged values, the yellow points are the individual echo values. The X-axis is time in seconds (one echo every 6 seconds) and the Y-axis is the reported SNR (dB in 2500Hz)
Here the average echo strength settles down to around -27dB, But you can see individual echoes as strong as -20dB (+7dB). It's harder to pin down the value of the weaker echoes as there is a lot of uncertainly in them. Many are too weak to be detected, but there are certainly some about 5dB weaker then the average and many other much weaker. Here it's even more important to average echoes. Just looking at a single echo could give you an SNR of -20dB, or no detectable echo at all. Note that it's hard to measure weak echoes even when you average many of them. It's even harder to measure the strength of a single weak echo, so individual echo measurements of weak echoes are subject to a lot of uncertainty. You can sometimes measure a weak single "echo" when in fact you are just seeing an event due to the random variation in the noise background which just happens to mimic what you'd expect for an echo. Bottom line is that you can't trust any individual echo numbers measured when the average is as low as -27dB on a 25Hz wide signal.
Note that the average SNR isn't the average of the individual SNRs. It's the SNR determined from the sum of the FFT spectrum of each echo. This tends to average out random fluctuations in the noise while the signal builds up, making it easier to get an accurate overall SNR reading from multiple echoes.
Even when you average, there will still be some uncertainly in the results. Here are several sets of echoes, taken one after the other. You can see again, that if you average a long enough sequence, each one will eventually converge on an approximate value. In this case, after about a dozen (fairly strong) echoes, the average SNR is about -8.4dB +/- 0.2dB, though individual echoes as strong as -7.2dB and as weak as -10.2dB were recorded.
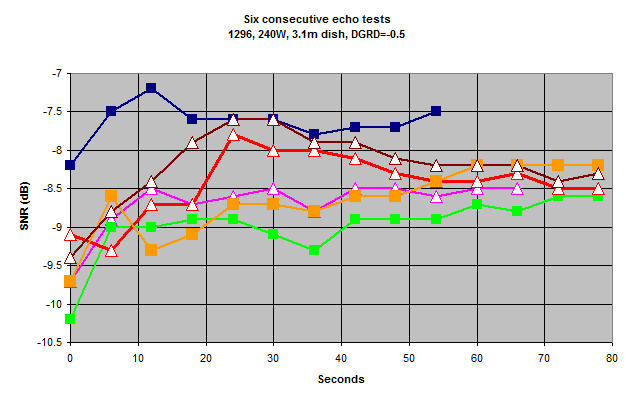
Average SNR reported in 6 consecutive echo tests.
Identifying Echoes
[Note: Ignore the high Tsec numbers. Software bug, now fixed)
Strong echoes are easy to identify. They appear as a peak on the echo graph, The "Q" column in the data windows of WSJT-X rises above 0 (maximum is 10) and the dBerr column in the data falls to values of 2 or less (minimum is 0.5). However very weak echoes can be more difficult to identify. It's generally easier to identify weak echoes when their Doppler spreading is small, which typically happens at lower frequencies. For example, here is what -30dB echoes with a 2Hz width look like. This would be typical of 144 MHz.
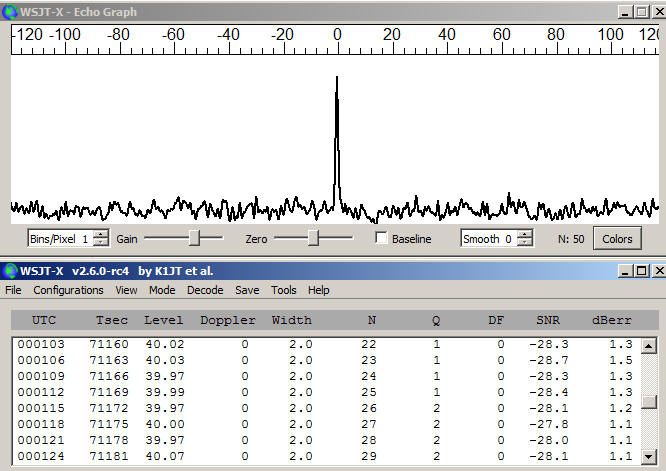
As you can see, the peak on the echo graph is very obvious, and after 30 echoes, the Q value has risen to 2 and the dBerr has fallen to 1.1. These are all clear, unambiguous signs that a real echo has been observed. The SNR isn't exactly -30dB, but small errors can show up on weak echoes. There's clear room for WSJTX to identify even weaker echoes with this spreading. Echoes are still visible down to at least -35dB
Now if we look at a signal of the same strength, but with a width of 25Hz, such as would be typical on 1296MHz, things look a little different.
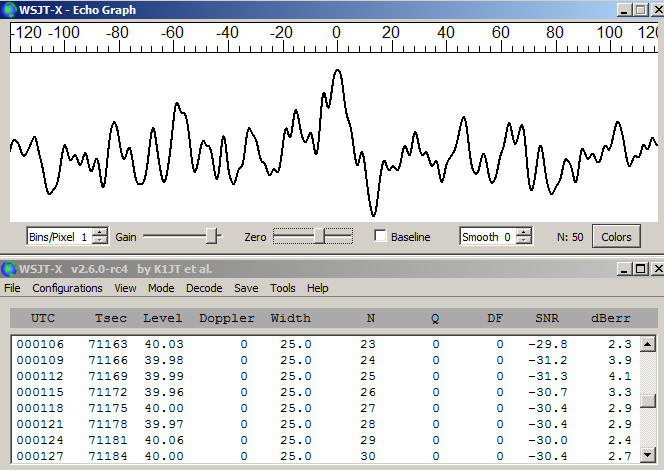
The peak is broader and smaller and quite difficult to positively identify as a real peak. Q has not risen above zero and dBerr is still around 2 to 4, but is fairly consistent. The SNR is also fairly consistent at around -30. In fact WSJTX has correctly identified an echo at about -30dB here, but this is about the weakest 25Hz wide echo that it is capable of positively identifying.
For even more widely spread signals, such as might be found at 10Ghz, the following screen shots show the situation with a -25dB signal and 200Hz spreading. This time with 50 echoes.
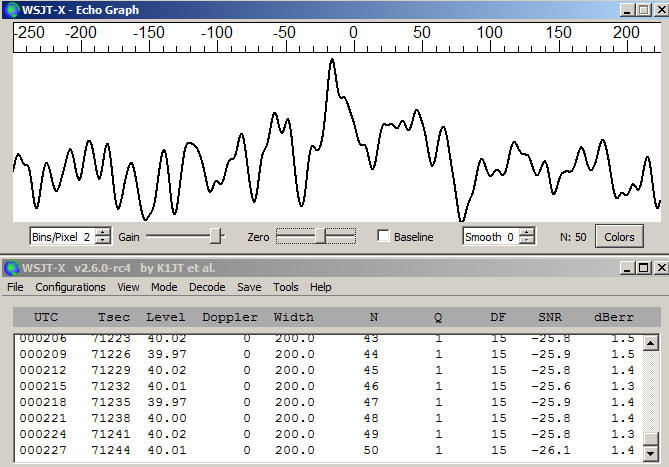
Though 5dB stronger, the peak is difficult to visually identify. Remember, the peak is 200Hz wide, so a single narrow spike near 0Hz is more likely to be a noise spike than the peak! However, after 50 echoes, Q=1 and dBerr is between 1 and 2 and pretty stable. This would indicate that a real echo is present. The calculated SNR is just over -26dB, which is quite close to the value used to synthesize the signal. DF (the difference between the expected echo frequency of 1500Hz and the observed peak maximum) was 15Hz. While this might indicate an issue with narrow signals, it's not unusual for signals with wide spreading. Note that at -30dB (as was used for 2Hz and 25Hz spreading), no signal was visible, Q was zero and dBerr was high. There was no confirmation of an echo.
CAUTION. If you run a very long series of echoes in order to try to detect any kind of echo, you may eventually see something appear in the data - even when no signal at all is present. Just the random nature of noise can sometimes accumulate in such a way as to generate numbers that could look like a signal. Generally Q will stay at zero, but it's possible for dBerr to start falling. For example here is a case where no signal was present
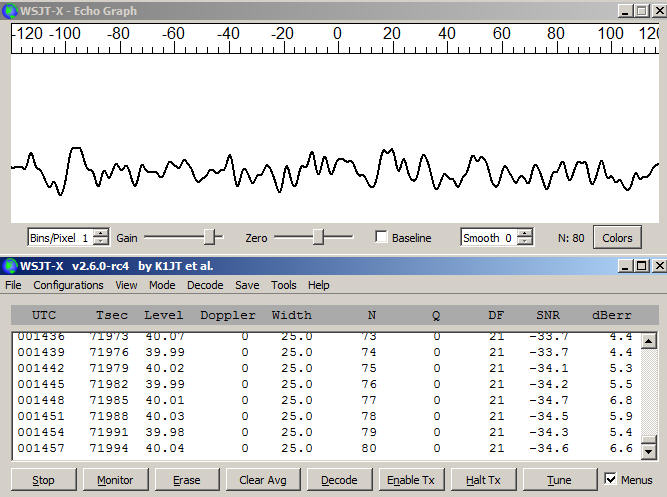
A number of factors would suggest this is not an echo. There's no visible peak. Q is zero, dBerr is quite high and fluctuating and DF at very high at 21 for this 25Hz wide signal. DF is normally >10, at least for signals with narrow spreading (30Hz?). For wider spread signals (200Hz) it appears that DF may be outside this range and still indicate a valid echo. In any case a large value of DF would appear to throw some doubt on the validity of an echo. The indicated SNR (-34.6) is also well below the level at which a 25Hz wide echo can be reliably detected (which is around -30dB). So as much as you might want to believe that something like this is showing an echo, it isn't. It's just random noise which can sometimes result in the output of the echo algorithm generating numbers which look at first glance as though they could be signs of an echo.