Predicting Libration Fading on the EME Path
by Charlie Suckling G3WDG
14 June 2010
Introduction
All EME operators will be very familiar with the effects of libration fading. A very detailed and informative paper was
written on the subject some 36 years ago, by Dick Turrin, W2IMU (ref 1). At lower frequencies, the main effect of
libration fading is noticed as fluctuating signal amplitudes, which frequently "chops" up Morse code characters such
that dots may be missing or dashes broken up into several dots. When signals are weak, it is possible that only the
peaks of the signal can be copied, which makes cw extremely difficult or impossible to copy.
At higher frequencies, the amplitude fading can no longer be distinguished by ear, and the signal becomes "smeared
out" in the frequency domain so that it no longer sounds like a pure tone, but more like a musical "hiss". The more
severe the libration is at any particular time, the weaker the signal appears to sound, since the energy is spread out
over a wider bandwidth and is thus more difficult to decipher against the background noise.
Most operators will also have observed that the fading rate (or amount of spreading) varies with moon position in the
sky, being generally less with the moon near the horizon and worst with the moon at transit. It has also been observed
that on some occasions the fading becomes very slow (and signals very narrow). EME operators sometimes report
"good conditions", which I believe may sometimes be attributable to low libration fading rates. Examples of some
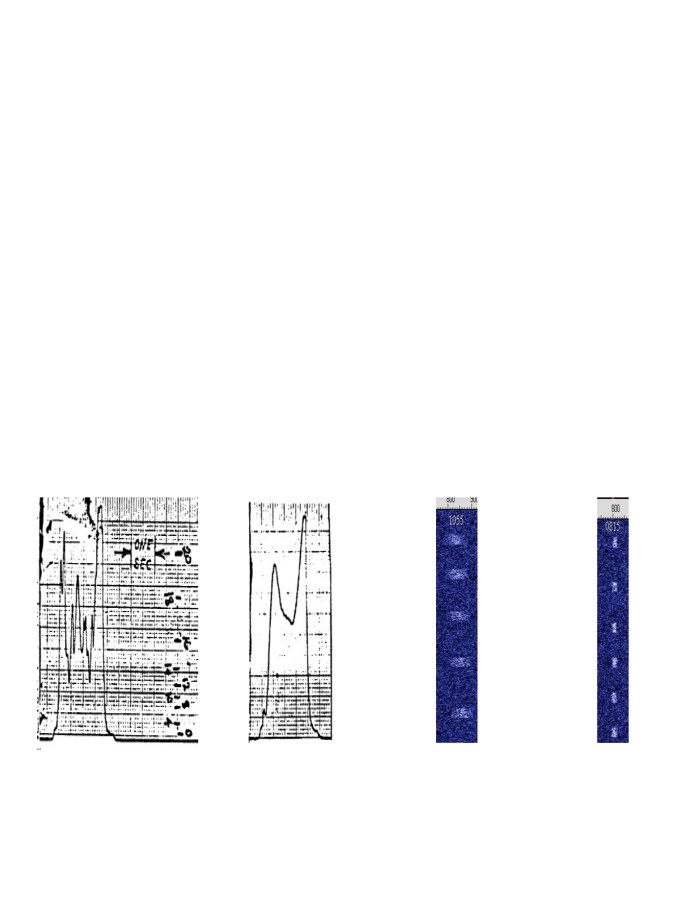
signals with differing fading rates and spreading are shown below.
1630z
1130z
1055z
0815z
W2NFA 26 July 1973 1.3GHz W2NFA 12 July 1973 1.3GHz
G3WDG/G4KGC 19 March 2010 10GHz
I recently became interested to see if it would be possible to predict when low libration "events" would occur,
since it might be possible at such times to make contacts which might otherwise be too difficult under average
conditions. At lower frequencies, signals might exist for long enough on peaks of fading to be copied,
while at higher frequencies the signal energy would be more concentrated, and thus possibly easier to distinguish
from the noise. This could be especially valuable for EME experiments on bands above 24GHz. It is also possible
that certain weak-signal data modes might be able to operate at such times, on bands where they cannot normally
be used. This has yet to be tried experimentally. Being able to predict libration fading could also help to avoid
particularly bad times for skeds.
Predicting Libration
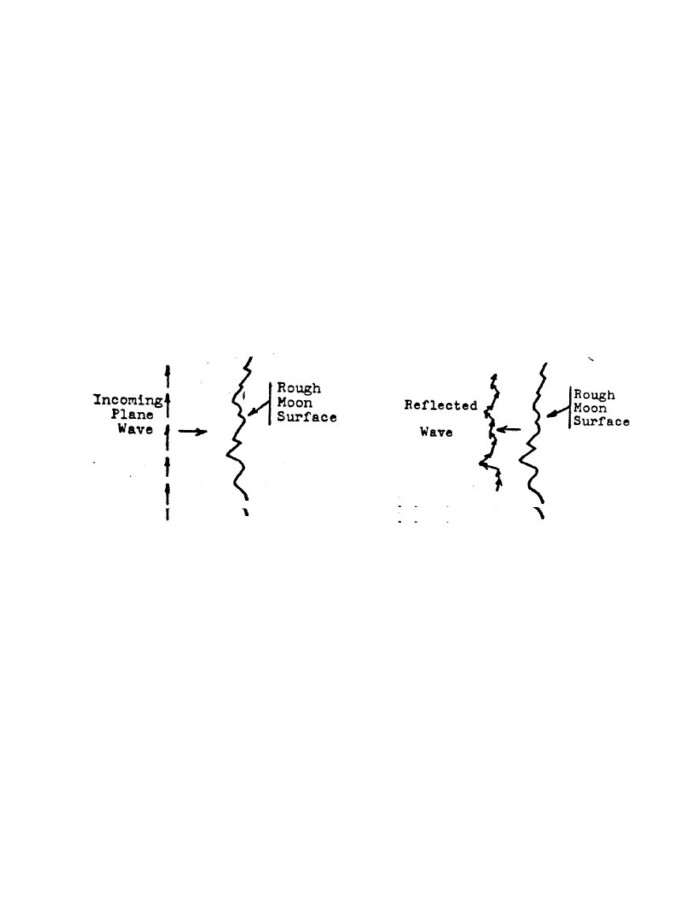
Briefly, the fading is caused by multipath propagation from the rough surface, as illustrated very clearly by Turrin:
The reflected wave that is received on Earth is a combination of all the individual reflections from points on the
moon's surface, and since there is almost always some degree of relative motion of the moon's surface as observed
from earth (referred to as libration), the individual reflections combine to give a fluctuating signal. Libration
minimum events occur when the relative motion is at a minimum, so to predict these events it is necessary to
predict when the relative motion is at a minimum.
Moon libration is of great interest to astronomers, as the cyclic wobble of the moon allows approximately 59% of
the moon's surface to be observed from Earth, over a period of time. According to Ref 2 , there are four separate
components to libration, which together contribute to moon's total libration motion. These are libration of latitude,
libration of longitude, diurnal libration and physical libration. These are described in relatively simple terms in the
reference. Fortunately it was not necessary to delve too deeply into all this, as astronomers have already written
excellent software to predict the libration relative to the centre of the Earth (geocentric) and relative to an
observer on the Earth's surface (topocentric). The latter is the one that interests us, since it applies to an observer
on the surface of the earth, and includes the all-important rotation of the earth velocity component tangential to the
moon's surface.
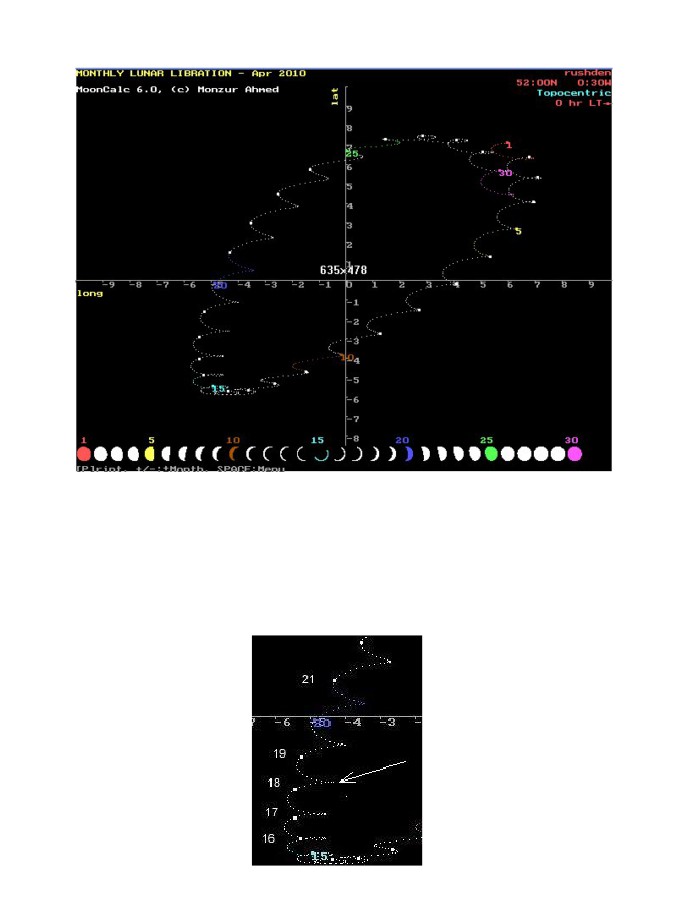
I found two programs which could display topocentric libration over a whole month, Lunar Phase Pro (ref 3) and
MoonCalc v6.0 (ref 4). Below is a screen capture from MoonCalc for my QTH for April 2010:
Topocentric Libration prediction for IO92RG for April 2010
The calculated lunar latitude and longitude points (dots) are spaced at 1 hour intervals, and the days of the month are
indicated on days 1, 5, 10, 15, 20, 25 and 30. The larger dots indicate 0000z. The libration minimum would occur
simply when the topocentric lunar latitude and longitude (indicated by the dots) change at the slowest rate, and this
can be estimated with reasonable accuracy by eye. For example, look at days around the middle of the month, as
shown below.
Looking at the 18th, and counting the one hour dots towards the 19th, it can be seen that minimum libration will
occur at about 0900-1000, since this is where the dots are most closely spaced (ie lunar latitude and longitude are
changing at the lowest rate). The diagram does not show whether the moon is above the horizon, of course, so this
needs to be checked with an ephemeris program to see if it is observable.
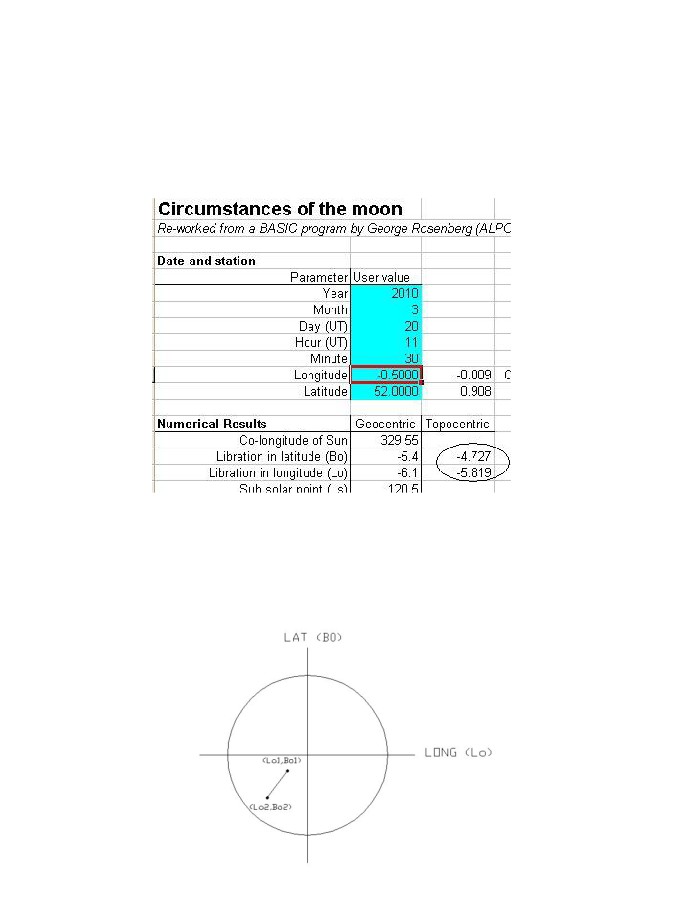
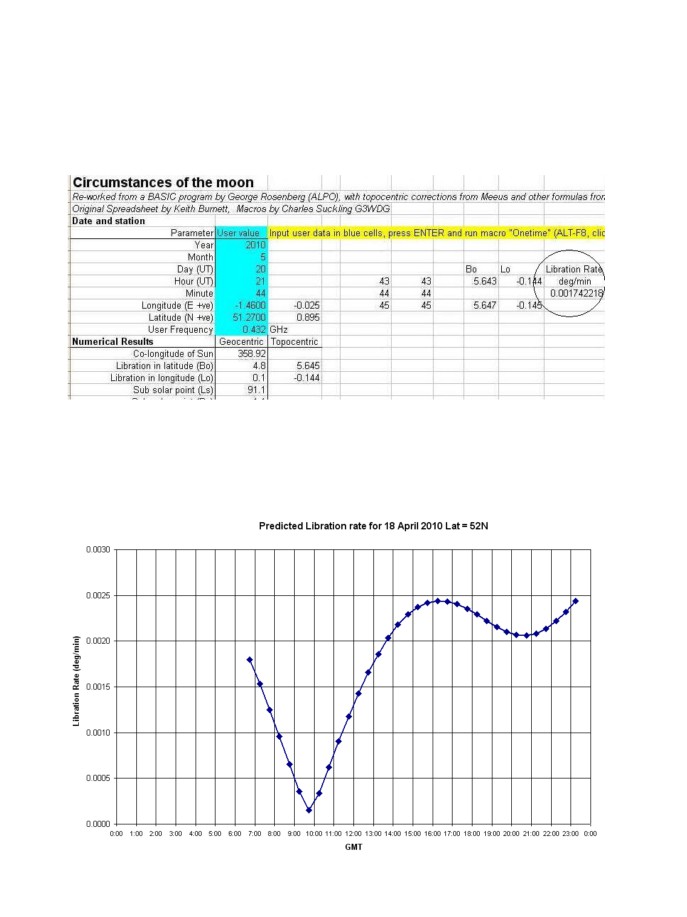
A means of getting greater precision was sought, and further investigations found a spreadsheet (Ref 5) , which
amongst other things can predict topocentric lunar latitude (Bo) and longitude (Lo) at any given time, as the
screenshot below shows:
While this spreadsheet predicts Bo and Lo at a given time, it does not calculate the rate of change, which is
required to predict the libration rate. I modified the spreadsheet by adding an Excel Macro to calculate Bo and
Lo 1 minute before and one minute after the entered time, giving values Lo1, Bo1 at T-1min and Lo2, Bo2 at
T+1min, as shown in the diagram below (note: the change in Lo and Bo was been grossly exaggerated for clarity).
The libration rate was then calculated by working out the distance between the two calculated points
using Pythagoras, and dividing by the time interval (2 mins), using the formula Libration Rate at time T
(deg/min)
= (SQRT ((Bo2-Bo1)**2 + (Lo2-Lo1)**2))/2. . This is a linear interpolation of what are really
spherical changes, but the errors are negligible over such a short time interval.
A screenshot of part of the modified spreadsheet is shown below:
A new macro was then written, to predict the rate of libration every 30 minutes over a 24 hour period so
that predictions for one day could be made easily. A graph of the output is shown below for 18 April, showing
that minimum libration occurs at about 0940z, which agrees well with the timing interpreted by eye from
MoonCalc above.
Testing the Predictions
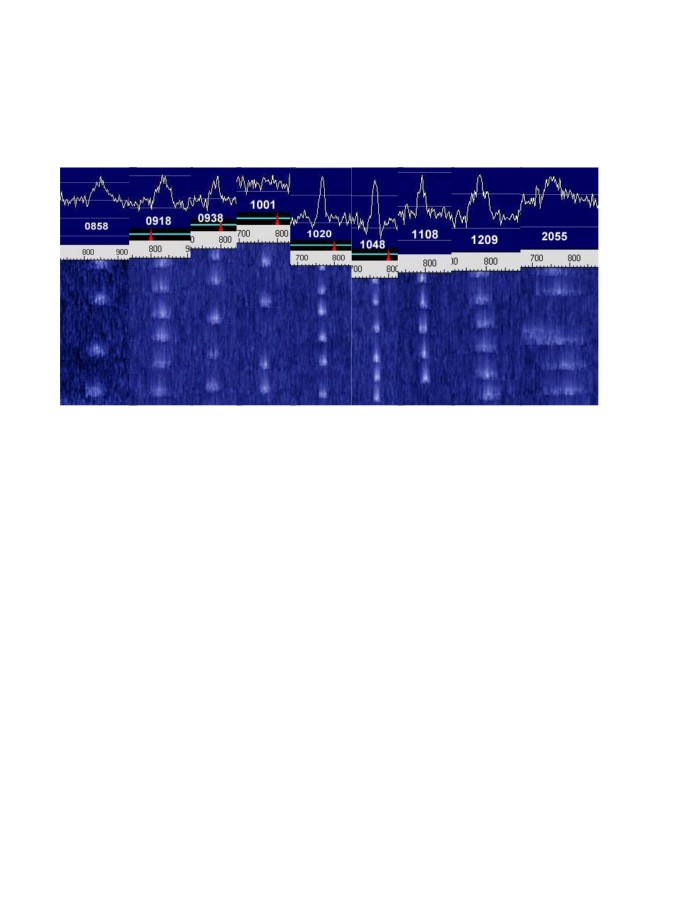
Predictions were then made for the next available libration minimum (21 March 2010) and echoes were recorded
on 10GHz by G3WDG/G4KGC and on 3.4GHz by G3LTF. Below are the Spectran captures for the 10GHz echoes,
taken before, during and after the predicted minimum.
It can be seen that the signal started off fairly wide at the first observation at 0858, which was just after
moonrise, became progressively narrower over the next two hours or so, reached a minimum at 1048 and then
became progressively broader again. The third echo in the 2055 waterfall appears broader than the other echoes,
and was caused by another station on the same frequency trying to attract our attention!
The timing of the point of minimum echo width also corresponds closely to when the Doppler shift reaches its
maximum amount , ie the time when it briefly stops changing (thanks to G3LTF for this observation). The
changing Doppler can be seen in the above plots in the waterfall traces, as a horizontal displacement from echo
to echo. At 0858, for example, the echoes are moving progressively higher in frequency while at 1209 they are
moving lower. At 1048 the echoes are practically all on the same frequency.
It can also be seen that the distribution of energy in the echoes changes from echo to echo. Some "fine
structure" appears to be present in many of the echoes, which is not the same from echo to echo (eg look at the
1108 set).
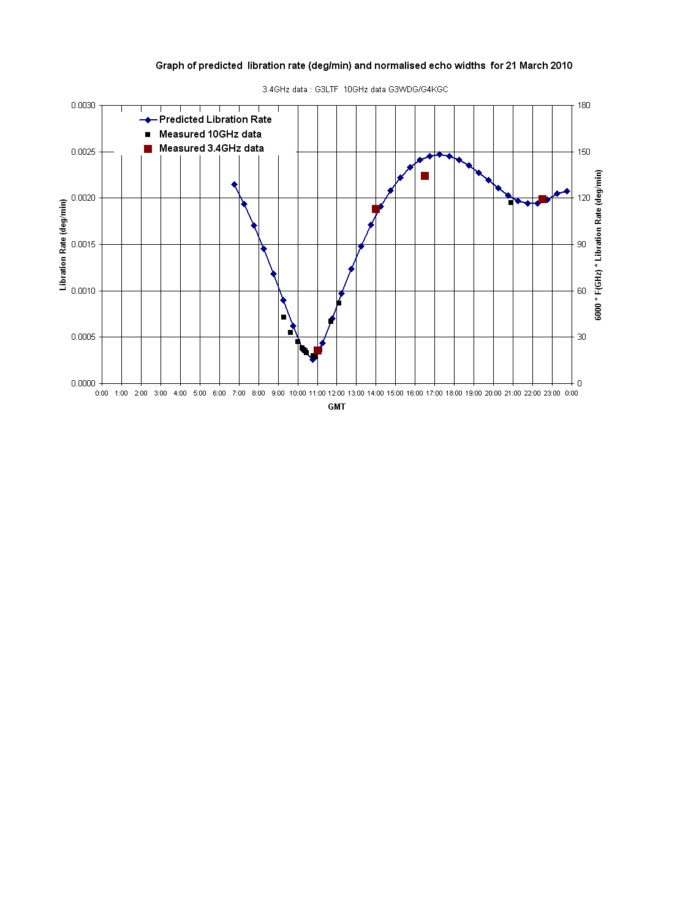
The width of the echoes over the observation period were then measured (visually from the Spectran plots), and
are plotted below, together with results obtained on the same day by G3LTF on 3.4GHz, on the same graph as
the predicted libration rate. The scale of the right hand axis was adjusted so that the 10GHz echo width data
fitted the predictions as closely as possible around the minimum region.
The timing of the 10GHz results matched the predictions very closely. The width of the signals also tracked the
predictions well, both for the data points not only around the minimum (where the fitting was done) but also
later in the day well away from the minimum (2055z). G3LTF's 3.4GHz results also fit the predictions well, if
his observed signal widths are multiplied by the ratio of the operating frequencies (10.4/3.4).
A formula for predicting signal width from this experimental data was thus derived to be:
Echo width (Hz) = 6000 * F(GHz) * Libration Rate (deg/min)
This agrees within 10% with recent theoretical predictions by GM4JJJ (Ref 6), which are higher than the
experimentally derived values. It should be noted that the 6000 factor is likely to apply to systems where the
antenna beamwidth is larger than the moon's diameter. Observed libration is lower when the antenna puts a "spot"
on the moon.
Further Observations
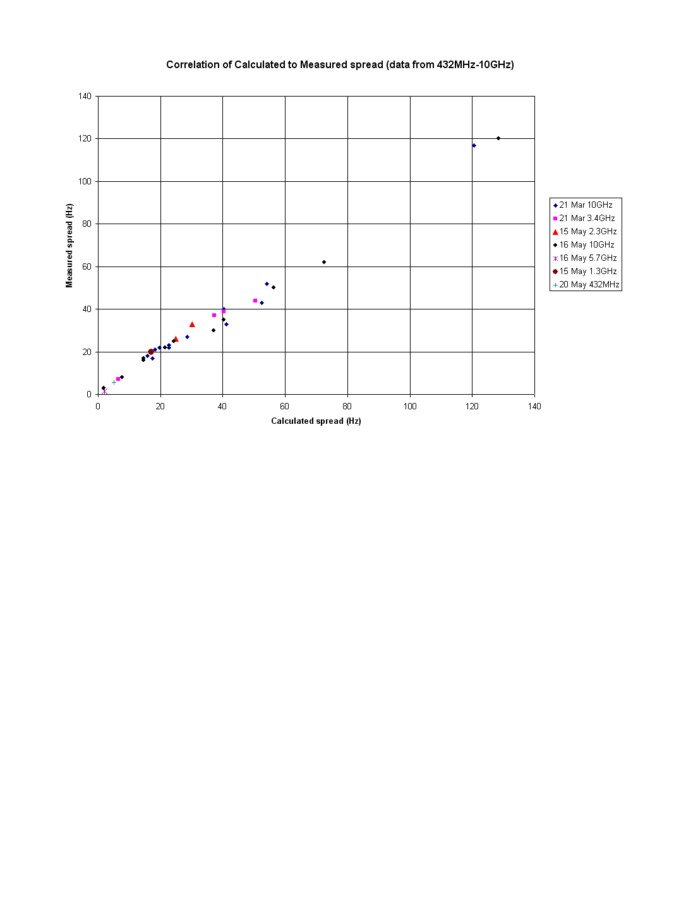
Since the initial observations were made a lot more data has been collected. Thanks go especially to
G3LTF, who has provided recordings of his echoes on 432MHz, 1.3, 2.3, 3.4 and 5.7GHz for analysis. The
graph below shows how the measured echo widths compare to those predicted by the simple formula above. The
data falls on a straight line (within experimental error) showing that the formula above works well, at least down
to 432MHz, for predicting echo width. The slope of the best straight line fit is not exactly 1 however, and it is
possible that the initially chosen 6000 factor may need to be modified slightly in the light of the extra data. This
will be looked again at once more data has been collected. Please watch the website version of this paper for
more details.
Variations in Libration - Geographical
The spreadsheet was modified further to produce daily graphs of libration rate at a number of different latitudes. It
became immediately apparent that the libration rate varies considerably with the latitude of the observing station..
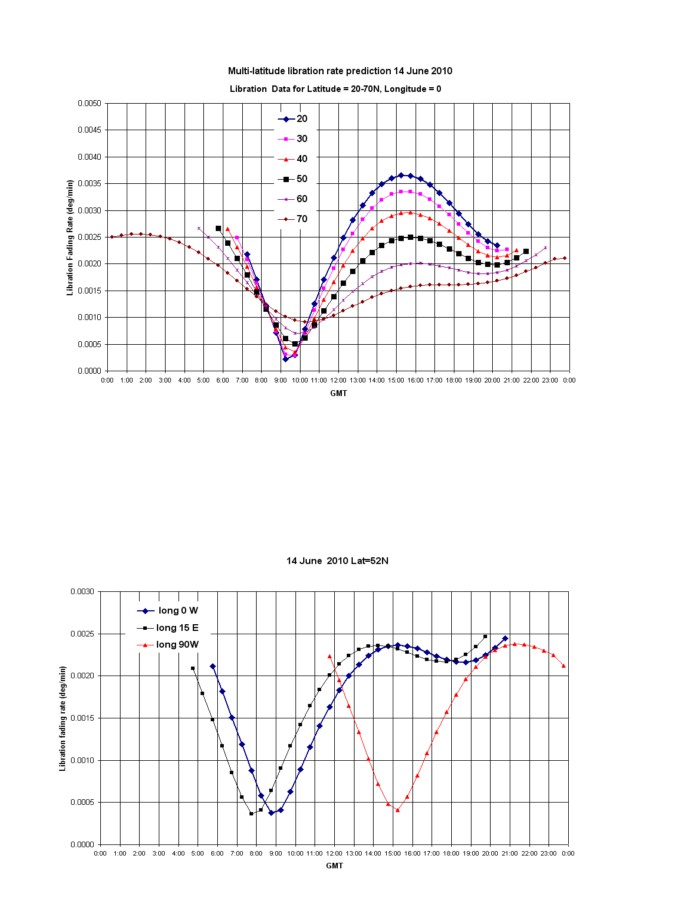
These effects can be seen in the following graph, which shows the predicted fading rates for 14 June 2010 for latitudes
of 20 to 70 degrees, with longitude = 0.
Stations nearer to the equator observe more rapid libration fading (and hence wider signals) near transit (~1400z in
this case). In the region where the libration goes to minimum, the libration rate depends on the latitude of the station,
and in this case stations between 30 and 40 degrees latitude will experience near zero libration rates, at around
0845z.
The time at which the minimum occurs varies by up to one hour for stations at the same longitude, but different
latitudes.
The spreadsheet was also used to look at the effect of station longitude, for constant station latitude. . The graph below
shows the predictions for stations located at lat=52N and longitudes of 0, 15E and 90W for the same day as above.
Stations further east experience the minimum earlier than those to the west, by approximately 4 mins/degree longitude.
The depth of the minimum is almost the same for all three stations. The small differences in depth are attributed to the
declination of the moon changing by a small amount between the times the stations experience the minimum, which
changes the geometry slightly.
Variations in Libration during the Lunar Month
A set of predictions was run for 28 days during June, to see how the libration rate changes from day to day. The
results are given in the web version of this paper. The following conclusions were drawn:
1. On all days, libration is lower near moonrise and moonset compared to values at transit, for all latitudes.
2. Libration minima are only observed with the moon above the horizon for 11 days in the month
3. For days where there is a minimum, there are only one or two days when the minimum is "deep", and these are
not the same days for stations at different latitudes.
4. An interesting case occurs on 18 June, with the moon near zero declination, when stations at all latitudes see
both the same amount of fading, and also at the same local times ie at local moonrise and moonset.
The geometry in this case is interesting. With the moon at 0 deg declination, it is located perpendicular to the
spin axis of the earth, so that at moonrise (and moonset) stations on the Earth are moving directly towards (or
away) from the moon, with no component of their earth rotation velocity being tangential to the moon. (It is this
velocity component that is responsible for most of the observed libration). Thus the libration component due to
Earth rotation at these times is zero and the observed libration rate (0.0075 deg/min) at the minimum is due to the
other (much smaller) libration components.
This example also help us to understand how "deep" minima occur. It has been seen above that deep minima
usually occur some time after local moonrise. At these times the component of the station's Earth rotation
velocity tangential to the moon's surface will, for a short time, cancel the sum of the other three
libration components such that there little net libration. The fact that deep minima occur on different days for
different Earth latitudes can be understood in the same way, as the geometry depends on both station latitude,
moon declination and what the other librations are doing at that time.
A Libration "Zero" Event - May 16, 2010
The spreadsheet showed a minimum for our location on 16 May when the libration rate went to practically zero
(predicted 10GHz signal width 2Hz). This provided a good opportunity to test to the accuracy of the predictions.
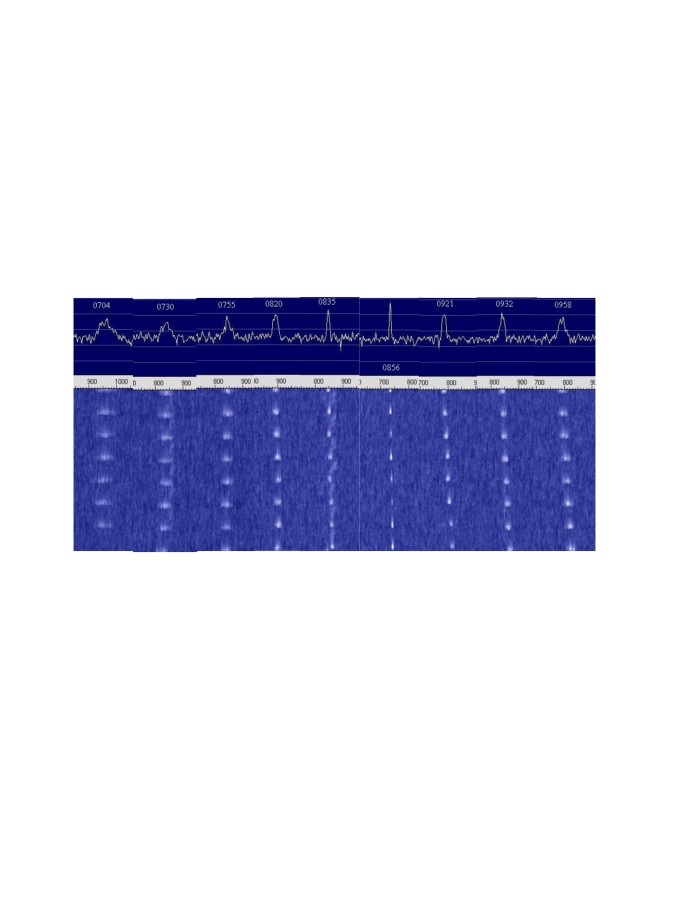
G3WDG/G4KGC tested on 10GHz during the event and the following sequence of Spectra captures shows the
results from 0704z to 0958z.
The signal width went to nearly zero width at 0856 and we observed a corresponding very slow fading fate, such
that some echoes in the sequence are barely visible, having been knocked out by deep slow fades. This variation in
echo strength on such a long timescale has not been observed before to my knowledge on 10GHz, and it not visible
in the other traces.
As expected, the signal amplitude peaked at the libration minimum - this effect had been used on 21 March to
observe echoes with Spectran with only 1-2W TX power into a 3m dish, on 10GHz:.
Predicting Libration Fading between two stations
A simple model has been produced to calculate the libration fading rate between two stations. This is of interest,
as it would allow skeds to be arranged at times when libration is at a minimum between two stations, if the contact
is likely to be marginal or to experiment with narrowband data modes. The model has been implemented as a
spreadsheet, where the lunar longitude and latitude are calculated in the same way (ie two minutes apart) for the
two stations separately. For station A the spreadsheet calculates (LoA1, BoA1) at T-1 and (LoA2, BoA2) at
T+1, and for station B (LoB1, BoB1) and (LoB2, BoB2) for the same times. New points are then derived which
are the averages of the lunar latitudes and longitudes observed by the two stations at T-1 and T+1 as shown in
the diagram below: The distance between them is then calculated as was done for the single station case, and
divided by 2 to obtain the “mutual” libration fading rate in deg/min.
A limited amount of data has been collected at the time of writing to verify whether this simple model works. A test
between G3WDG (Station A) and JA6CZD (station B) was made on 16 May 2010 specifically to test the two station
model. Both stations echo tested for 2 minute periods each between 0700 and 0800z and recordings were made.
At the start of the test, the model predicted a two way signal width of
64Hz and at the end 73Hz. Measurements of
JA6CZD's signal as received by G3WDG gave values of
55Hz at the start and
60Hz at the end. G3WDG's signal
received at JA6CZD measured slightly wider at 70Hz. Given the different signal levels and difficulty in estimating
echo widths with high precision, the agreement between the model predictions and the measurements seems to
be quite close.
Since that test, some further results have been obtained, as shown below.
Date
Time Station A Station B Predicted width Measured width Band
Comment
16 May
0930
G3WDG SP7JSG
44Hz
35Hz
10GHz Weak signal
16 May
0741
G3LTF VK3NX
38Hz
35Hz
5.7GHz see figure below
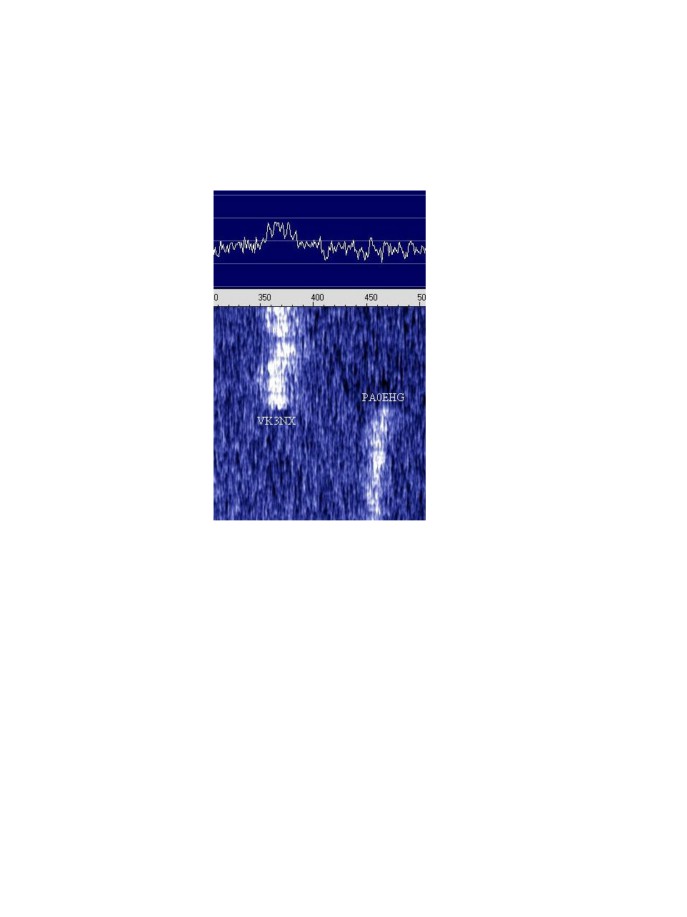
16 May
0741
G3LTF PA0EHG
25Hz
20Hz
5.7GHz see figure below
PA0EHG and VK3NX received by G3LTF on 5.7GHz at 0741z 16 May 2010,
illustrating differing signal widths for two widely separated stations
Using WSJT modes during Libration Minima
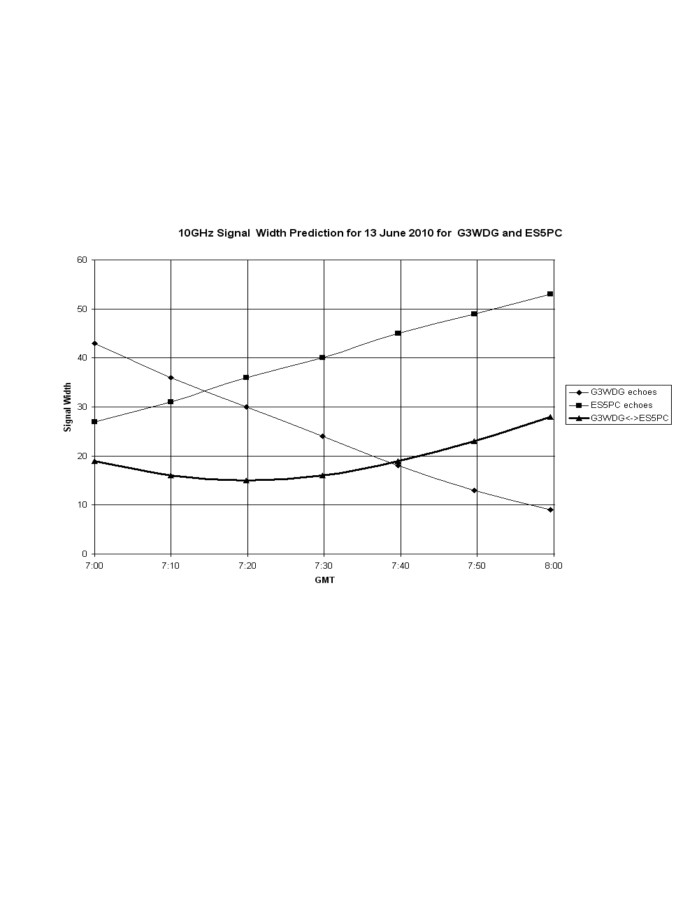
10GHz tests between G3WDG/G4KGC and ES5PC were carried out on 13 June, to investigate whether some of the
WSJT modes could be used on 10GHz EME, during periods of low libration. The test was planned to take place
when the mutual spreading was at its lowest (approx 15Hz). The two station spreadsheet was used to predict the
signal widths, and the results are shown below:
In line with the predictions above, the sked was arranged to start at 0700z, just before the minimum signal
width would occur. It is interesting to note that the mutual signal width (ie the width of one station received
by the other) is less than either station’s own echoes at the time. ES5PC observed this in practice during the
test.
Contact was initially established using JT4G (315Hz tone spacing). This had been tested successfully the
previous day by G4NNS, ES5PC and G3WDG, and was found to work well during high libration conditions
(with ~150Hz signal widths).
At Viljo’s suggestion (via JT4G!), we then tried JT4E (78.75Hz tone spacing) with excellent decodes and a
quick QSO, followed by JT4C (17.5Hz tone spacing). This proved to be more difficult, as the signals width
was starting to increase, but a QSO was completed. By 0745z, with predicted signal widths of 20Hz
(exceeding the tone spacing) , there were no more successful JT4C decodes.
Finally we tried JT65C, which also resulted in many successful decodes (of G3WDG by ES5PC) , but no
QSO, probably due to inexperience with JT65 at our end! G3WDG’s QSO log is shown below:
UTC Date: 2010 Jun 13
---------------------
065034 Transmitting: JT4G ES5PC G3WDG IO92
065100 13 -16 2.6 105 9 * CQ ES5PC KO38
1
0
065300 12 -17 2.6 179 2 # G3WDG ES5PC KO38
OOO 1 0
065500 1 -19 1.8 144 25 #
065608 Transmitting: JT4G ES5PC G3WDG IO92 OOO
065700 15 -17 2.6 118 24 * RO
1
0
065810 Transmitting: JT4G RRR
065900 14 -18 2.5 -20 0 *
73
1
0
070011 Transmitting: JT4G
73
070100 19 -19 2.5 -53 61 * PSE JT4E
1
0
070233 Transmitting: JT4E ES5PC G3WDG IO92
070300 3 -20 2.6 -339 5 *
070500 12 -17 2.6 -370 31 # G3WDG ES5PC KO38 OOO
1
0
070606 Transmitting: JT4E RO
070700 10 -20 2.7 -252 29 * RRR
1
0
070804 Transmitting: JT4E
73
070900 17 -19 2.8 -289 29 * PSE JT4C
1
0
071009 Transmitting: JT4C
73
071012 Transmitting: JT4C
ES5PC G3WDG IO92
071100 1 -24 2.6 -324 45 # G3WDG ES5PC KO38 OOO
1
0
071210 Transmitting: JT4C RO
071300 0 -25 1.9 -378 40
071500 4 -25 2.5 -173 19 * RRR
1
0
071605 Transmitting: JT4C
73
071700 2 -25 2.7 -77 36 *
RRR
1
0
071900 4 -25 2.6 -114 41 *
73
1
0
Conclusions
1. A method has been developed to predict libration fading for one station with high accuracy, which has been tested
against measured data on all bands from 432MHz - 10GHz.
2. A model has been produced to calculate libration fading between two stations, and is showing promising results.
3. Libration minimum events can be used to detect echoes with marginal systems.
4. Being able to calculate libration fading allows skeds to be arranged when fading as at a minimum, which can be
useful for marginal contacts especially on the higher microwave bands, and for data modes.
5. Recent releases of GM4JJJ's MoonSked program now include provision for predicting signal width, both for own
echoes and for two stations. This is available in both the Sked Maker and Moon Track windows.
6. Certain narrow-band WSJT modes can be used on 10GHz EME, given the right libration conditions. JT4G has
been shown to work with high levels of libration spreading., and is recommended for initial tests.
Acknowledgements
I would like to thank Petra G4KGC for helping to collect our 10GHz data, Peter G3LTF for providing recordings
of his own echoes and other signals on all bands from 432MHz to 5.7GHz. I would also like to thanks Petra
G4KGC, David GM4JJJ and Joe K1JT for many useful discussions, and Viljo ES5PC for suggesting (on-air) that
we try JT4E, JT4C and JT65.
Libration Spreadsheet/software downloads
1. Single station, one time:
2. Single station, predictions for 24h :
3. One Longitude, multi latitude for 24h :
4. Two station, one time :
5. MoonSked by GM4JJJ:
References
1. Technical Report #16 January 1974 [Crawford Hills Notes] by Dick Turrin W2IMU
2. Physics Forums, "Why Doesn't the Moon Spin?", comment 14 by "Janus"
3. "Lunar Phase Pro" by Gary
4. "MoonCalc" by Monzur Ahmed
5. Excel Spreadsheet "Circumstances of the Moon" by Keith Burnett
6. GM4JJJ, Private Communication May 2010
This article may be viewed on-line at
including any updates, links to spreadsheets and software downloads