.jpg)
EME Echoes
Note. This article is quite long and quite detailed. If you just want basic operating instructions for the new echo mode in WSJTX260-rc3, you can skip to Echo Mode Instructions. Please forgive typos and errors. This is a work still in progress.
If you transmit an RF signal to wards the moon, some of it is reflected back off the moon and some of that refection is captured by your antenna. That's an EME echo, what more is there to say? Quite a lot actually...
What Earthbounce would look like...anyone for MEM?
What goes up and what comes down?
What goes up is straightforward. In echo testing you normally transmit a single audio tone at a known frequency. For WSJTX in echo mode that's 1500Hz and you can't change it. Normally the transmission lasts for about 3 seconds and the echo is received in a 3 second window, so there's a 6 second cycle time for one echo.
What comes down is the complicated part. At perigee, radio signals take about 2.43s to return from the moon. At apogee they take about 2.71s. That means that the length of the echo you hear can vary from about 2.4 to 2.7 seconds. The frequency spectrum of the echo starts out as a single narrow peak at 1500Hz. When it comes back it has been influenced by an overall Doppler shift in frequency which is determined by the rate of change of the moon's distance with time. One source of this is the change in distance as it moves from apogee to perigee, but this happens pretty slowly. The relative speed of the earth and moon is around 35km/hr at most. That means that the Doppler shift at 1296 MHz varies from 0Hz to around 40Hz. However there is a much larger speed component which is determined the the elevation of the moon and the rotation speed of the earth. When the moon is rising, the earth's rotation is moving you towards the moon, and when the moon is setting it's moving you away from the moon. The rotational speed of the earth is about 1670 km/hr, which causes a large Doppler shift. When the moon is at peak altitude (transit), the Doppler shift caused by the earth's rotation drops to zero. All of these add up to an overall Doppler shift which can be calculated. At 1296 MHz this shift ranges from ~0Hz to around +/-2000Hz
If nothing was moving and the moon was a uniform reflective sphere, the returned echo would have the spectral shape of the the r=transmitted signal, a narrow spike at the transmitted frequency and proportional in intensity to the transmitted power. But that's not the case. There are modifications to the return echo spectrum and intensity sue to lunar libration, which Wikipedia describes as "... libration is the wagging or wavering of the Moon perceived by Earth-bound observers and caused by changes in their perspective. It permits an observer to see slightly different hemispheres of the surface at different times...". Libration is explained in detail here: https://bobatkins.com/radio/doppler_broadining_libration.html. Libration is also explained here https://en.wikipedia.org/wiki/Libration
What libration does is to broaden the returned signal. In the case of 1296 the returned echo can be up to about 30Hz wide (the transmitted signal <1Hz wide). In addition, since the surface of the moon is far from plat, with peaks of up to over 4km high, the reflection is non uniform. The signal reflected form various parts of the moon will differ in phase, and the phase difference will differ with frequency. The nature of the variations also changes rapidly with time, so from second to second (and millisecond to millisecond) the spectral makeup of the returned signal changes, as does its amplitude. Basically the returned echo at any instant in time is a mess, though when averaged over a long enough time, it has a fairly predictable average shape and amplitude.
This is what two consecutive return echoes on 1296MHz with a Doppler spreading of 30Hz might look like. The 1500Hz signal is visible, but distorted both by noise and by libration effects. Their spectrum is different and their power (a function of area related to peak height) is different.
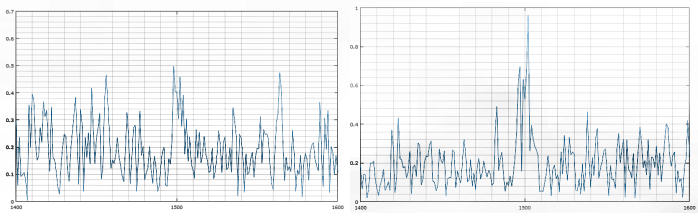
Two 2s echoes representative of what a 30Hz spread -15dB echo looks like, typical of 1296MHz operation.
The consequence of this signal "distortion" is that you can't get a lot of information out of a short (typically 2s) echo. You need to average a lot of them to get statistically meaningful numbers. The weaker the echo, the more you need to average before you can a lot of faith in the echo strength (and shape if that is what you are interested in). The peak shape can change slightly from band to band depending on the antenna beamwidth (large antennas at high frequencies may only illuminate part of the moon) and the frequency being used (the mode of reflection can be different at different wavelengths and may depend on local surface roughness).
Measuring Echoes
Since the very early days of WSJT, there has been an "echo" mode. It reported numbers attributed to both echo strength and echo width. This was derived from a previous stand alone program written by K1JT and it worked quite well for signals with narrow spreading and low rates of change of Doppler shift, such as might be seen on 50 and 144MHz, however at higher frequencies it becomes increasingly less accurate as Doppler spreading and rate of change of Doppler shift became larger. With 30Hz spreading (as might be found on 1296), it was around 12dB low, and with 300Hz spreading, as might be found at 10Gz) it was around 23dB low. So the reports for signals with significant spreading were always much too low (though at any give spreading value, they were consistent). The same echo mode was moved to WSJTX pretty much unchanged except for the mechanism of Doppler control. Up to WSJT10, audio Doppler control was used. In this scheme the TX and Rx frequencies were set to compensate for Doppler shift, then the WSJT program changed the frequency of the TX tone (nominally 1500Hz), so as to make the echo return at the same frequency as the frequency to which the Rx was tuned, even though the Doppler shift value was changing. The audio frequency Doppler tracking worked very well and allowed echo testing to be done using rigs that had no ability to track Doppler using CAT control, or Rigs that has 10Hz frequency control steps. With WSJTX, Doppler control was changed to use CAT control of the radio. The result was that the echo signal would "smear" if you were not tracking Doppler shift with 1Hz steps. This resulted in even lower accuracy of the echo strength. The code still worked well for its original design purpose of estimating the SNR of narrow echoes (and relative SNR for wider echoes of a constant width), but in the last 20 years (WSJT came out in 2001) the higher frequency bands with widely Doppler spread signals have seen increasing activity and so some changes were needed to update the range of signals over which accurate SNR values were reported.
Over the last few years I had developed a series of programs written using Octave, a high-level programming language primarily intended for scientific computing and numerical computation. This enables a much more accurate analysis of echoes with wide spreading and rapid rates of change of Doppler shift. Unfortunately Octave is a scripting language (similar to C++), so the program couldn't be compiled into a stand alone executable, and so wasn't really ideal for sharing with others.
Working with Charlie, DL3WDG, we made some rather simple changes to the echo mode code in WSJTX 2.5.4 to see if we could improve the performance when measuring echoes on the microwave bands with widely spread signals, and we tested those changes on both simulated and real echoes. Basically, these changes involved integrating the area under the echo peak and using the calculated spreading in the calculation rather than attempting to measure it (which is difficult, especially on weak signals with large spreading). These changes seemed to work very well so we sent them along to Joe, K1JT, and other members of the WSJTX development team. They agreed that the code changes were a good idea and so Joe incorporated the idea (using his own properly written code and adding some new features) into what is now WSJTX 2.6.0. So the echo mode now gives accurate SNR measurements for stations working on the higher bands where Doppler spreading can be anything from 5Hz to 500Hz. There is some latitude in the exact center frequency of the echo, so 10Hz frequency steps should not affect the accuracy of the echo SNR calculation, but it will still "smear" the echo plot slightly. Doppler tracking via CAT rig control is still requires, but just about every EME station using digital modes on 1296 and up is using some sort of automatic Doppler control. The audio tracking scheme of WSJT10 allowed "dithering" of the echo frequency to minimize the effect of any birdies on echo measurement, but that's not available in WSJTX. This isn't really needed so much with the new echo algorithm, especially on the higher bands where you can almost always find a clear frequency. The new 2.6.0 code now gives accurate SNR values that don't change with Doppler spreading width, allowing comparison of, for example, 10Ghz signals with 30Hz spreading to those with 300Hz spreading. Both now give the same SNR, where the original code would show the 30Hz signals as about 10dB stronger! The new version will also better ignore any birdies or spurious signals that are not near the expected echo.
In addition to echo measurement, the new echo mode in WSJTX 2.6.0 allows the measurements of the SNR of a constant carrier signal. This can show the presence (and estimate the strength) of signals from a DX station that are too weak to decode or be detected by digital modes such as Q65. This will be the topic of a separate article
WSJTX v2.6.0 (-rc3) Echo Mode
WSJTX v2.6.0 -rc3 is now in general release as a limited time release candidate (08/22/22). It contains the new echo mode code as well as many other program changes (most of which will not affect EME operation). The release notes are at https://physics.princeton.edu/pulsar/k1jt/Release_Notes.txt. The program may be downloaded via https://physics.princeton.edu/pulsar/k1jt/wsjtx.html
WSJYX 2.6.0-rc3 can operate in a similar way to earlier versions, That is you can use CAT frequency control in "own echo" mode and you should see echoes build up at 1500Hz on the echo graph and SNR (signal to noise ratio) numbers appear in the main window. These numbers are averaged, so the more echoes there are in a sequence, the more stable and accurate the displayed SNR will be. However despite looking like earlier version of the echo program, it's actually operating in a different way. WSJTX 2.6.0-rc3 uses a combination of RF frequency shift to compensate for most of the Dopller shift, but it can also shift the frequency of the received audio to interpolate between CAT controlled frequency steps. If the CAT steps are 1Hz, it really doesn't need to do any audio frequency shifting, but if the CAT steps are 10Hz or 20Hz, the software now uses audio frequency shifting between steps to keep the center of the echo's audio frequency at 1500Hz.
In addition to this "normal" echo mode, the new echo software and be used in a way where a combination of RIT and audio frequency shifting is used to track the Doppler shifting of the echo. The audio frequency shift has a range of +/- 750Hz, so if the Doppler shift is less than that, no RIT is required and the software will use 100% audio frequency shifting to track Doppler. The program knows what the Doppler shift should be and so uses that number. This will put the echo at 1500Hz. If the Doppler shift is greater than +/- 750Hz, Rit can be used to bring it down into the +/- 700Hz range. So, for example, if the Doppler shift is 2314Hz, you can use 2300Hz of RIT and the program will then use audio shifting to track that Doppler until it has risen to 3050Hz or fallen to 1550Hz.
The control options are:
- STOP - stops the monitoring mode
- MONITOR - continuously looks at the incoming audio stream and reports an average signal strength (useful for measuring Sun Noise for example)
- ERRASE - erases the data from the display
- CLEAR AVERAGE - zeros the accumulator which adds and averages the signals to date
- DECODE - This has no function in echo mode.
- ENABLE TX - Starts and echo sequence. Also clear the average before starting to receive
- HALT TX - stops and echo sequence
- TUNE - Sends a 1500Hz tone. Click again to stop tone.
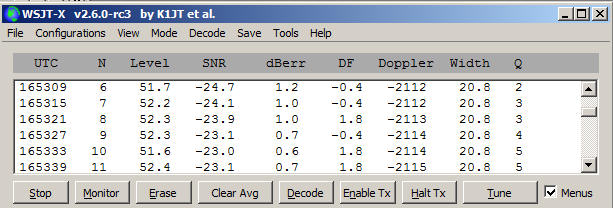
The data is displayed in the following columns:
- UTC - The time in UTC
- N - the number of accumulated Rx periods (echoes or continuous monitoring segments)
- LEVEL - the strength of the audio signal. The similar to the audio "thermometer" scale but has higher resolution and a longer integration time.
- SNR - The signal to noise ratio for echoes
- dBerr - the variance in the measured SNR. The lower the better. 0.5 is the minimum (best SNR value)
- DF - the difference in frequency of the echo from the 1500Hz tone transmitted
- DOPPLER - the calculated Doppler shift of the echo
- WIDTH - the calculated (not measured) with of the echo. Same as shown in Astronomical window
- Q - a measure of confidence that a real echo has been detected. 0-10 scale. For very weak signals, anything consistently much above a 1 or 2 probably means you have a real echo if the SNR is stable. You should also be seeing a visible peak on the echo graph to confirm the result.
The echo graphical winder is the same as in previous versions:
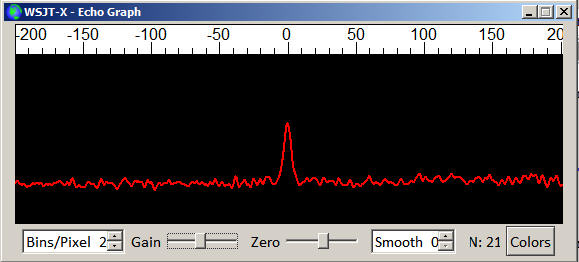
Echo plot after 21 echoes at an SNR of -23dB
It shown the accumulated frequency spectrum of the received audio. Assuming you are correctly Doppler tracking you are looking for a peak at 1500Hz if you are echo testing. The new audio shift interpolation between CAT steps should mean that the peak will now not be distorted when 10Hz or 20Hz frequency steps are used,
As documented below, SNR numbers will change over the first few echoes. The stronger the echo SNR, the fewer echoes will be needed before a steady state is reached. If the echo numbers have reached a constant value, you will also probably see dBerr drop to a low number (0.5) and Q to to a high number 10. Those parameters then indicate a good SNR estimation. For weak signals (say -23 or -24dB), it may take 20 or 30 echoes before things stabilize, for strong echoes (say -15 or better) it may take only 5 to 10 echoes. The first echo SNR may bbll be correct, but don't give them much weight because due to the nature of EME echoes, they maybe be 3dB or more above or below the true average echo SNR. Weaker, broader, echoes will take longer to reach a steady state
Using the new Echo Mode
Here are some step by step instructions on using the new echo mode with and without CAT frequency tracking and with and without using RIT RX frequency control.
1 - Echoes using normal CAT frequency control
- "Doppler Tracking: in the astronomical window should be checked
- Change mode to "echo"
- Doppler Tracking should default to "Own Echo". If it doesn't, select "Own Echo"
- To clear the data window click on "Erase". If this isn't the first set of echoes, also click on "clear avg."
- Click on "Tx Enable" to start a series of echoes.
- You should see data appear in the main windows and a peak should start to grow at 1500Hz in the Echo Graph window
- When SNR reaches a steady value and/or dBerr is less than 1 and/or Q is greater than zero and you have at east 5 or 6 echoes, you can click on "Halt Tx"
The SNR should now be reading your average signal to noise ratio (calculated in a 2500Hz bandwidth). To repeat the process go back to step #4.
Echoes using RIT - CAT not required
- "Doppler Tracking" in the astronomical window should be checked
- Change mode to "echo"
- Doppler Tracking will default to "Own Echo". Change this to "none"
- Read the value of "SelfDop" (self Doppler) from the Astronomical window and enter this value (or something close to it) in the RIT windows in the "echo mode" section of the Astronomical window. If "SelfDop" is +2136, you can enter +2100 or +2200 and everything will be fine. If the value of "SelfDop" is larger than the maximum RIT value you can set, then you can't use this method. You may have to wit for a time when "SefDop" is within your RIT range.
- Set the RIT on your rig to the value you entered in the RIT box in the Astronomical Window.
- To clear the data window click on "Erase". If this isn't the first set of echoes, also click on "clear avg."
- Click on "Tx Enable" to start a series of echoes.
- You should see data appear in the main windows and a peak should start to grow at 1500Hz in the Echo Graph window
- When SNR reaches a steady value and/or dBerr is less than 1 and/or Q is greater than zero and you have at east 5 or 6 echoes, you can click on "Halt Tx"
The SNR should now be reading your average signal to noise ratio (calculated in a 2500Hz bandwidth). To repeat the process go back to step #4.
Echoes when "Selfdop is between +750 and -750Hz. Neither RIT nor CAT is required
- "Doppler Tracking" in the astronomical window should be checked
- Change mode to "echo"
- Doppler Tracking will default to "Own Echo". Change this to "none"
- Make sure the RIT windows in the "echo mode" section is set to 0Hz
- To clear the data window click on "Erase". If this isn't the first set of echoes, also click on "clear avg."
- Click on "Tx Enable" to start a series of echoes.
- You should see data appear in the main windows and a peak should start to grow at 1500Hz in the Echo Graph window
- When SNR reaches a steady value and/or dBerr is less than 1 and/or Q is greater than zero and you have at east 5 or 6 echoes, you can click on "Halt Tx"
The SNR should now be reading your average signal to noise ratio (calculated in a 2500Hz bandwidth). To repeat the process go back to step #4.
Note that if you select "ave all" from the main "Save" menu, each echo will be saved as a separate .wav file, and these .wav files can be played back in the normal way via the File -> Open menu selection. If you save "Save" in the "Save All" condition, files will be written every 3 seconds while monitoring, so if you don't want to fill the disk, don't use "save all" while in monitor mode unless you actually want to save that data.
Measuring the SNR of a Dx Carrier
With the new echo mode you can measure the SNR of a DX carrier using pretty much the same steps as yuo use when measuring your own echo. The differences are"- You must enter the DX station Call and Grid in the boxes in the Main window. The grid should be 6-characters, and the grid you enter for yourself on the setup page should also be 6-characters. For me this would be FN54uj, not just FN54
- You must select "On Dx Echo" as the Doppler mode
- Your and the Dx station need to be very well frequency coordinated. You should be within 5Hz of each other, preferably with both stations GPS locked
- You run and collect data in "Monitor" mode.
- You can use CAT Doppler tracking or RIT assisted Doppler tracking, just as for echoes.
Example
Here's a look at the main window (s with the astronomical window as an overlay) after measuring a series of echoes using the RIT method. Tx power was around 5W on 1296 and a 3.1m dish was used.
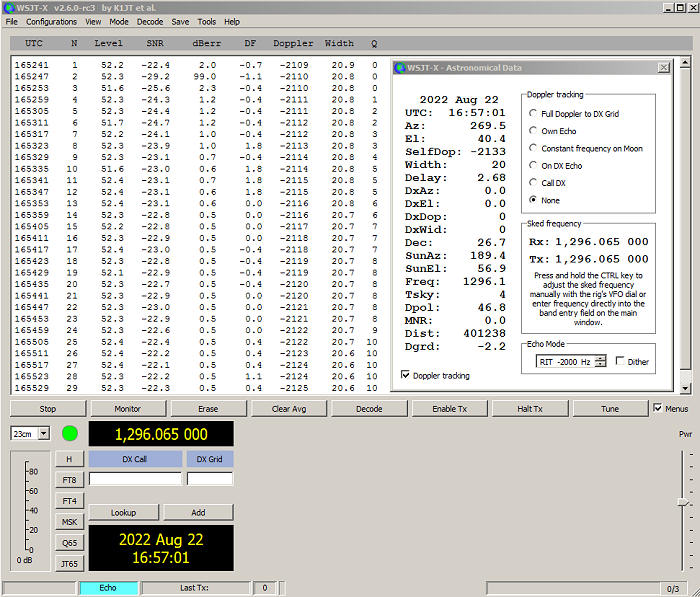
You can see that as the echo average builds up, the dBerr goes down (to a minimum of 0.5), which is an indication that the reported SNR value has stabilized. You can also see that "Q", the confidence in the echo goes up from o to 10 (it's maximum value). The SNR here is around -22.5dB (+/- 0.5dB). The RIT value was fixed at 2000Hz and WSJTX used Audio shift to compensate for the difference between 2000Hz and changing Doppler value shown in the Doppler column.
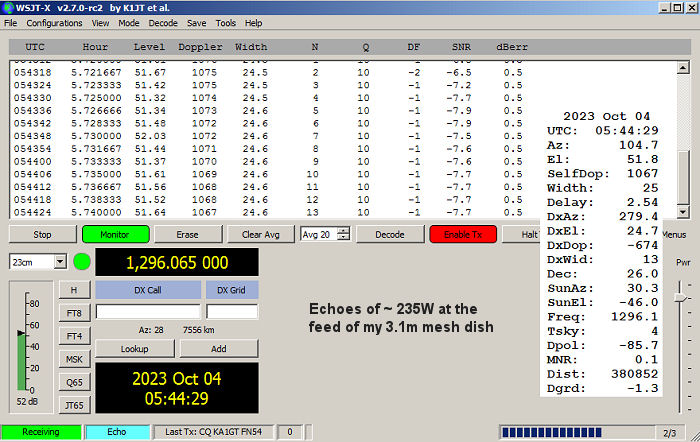
Here's an example of stronger echoes using about 235W at the feed to a 3.1m dish at a different time when DGRD was about 1dB lower.
Echo Testing - some numbers
So now, armed with an improved accuracy echo mode, it's likely that more stations will use echo testing to optimize their EME setup. In doing do it's important to realize which factors affect echo strength and how it can be used. First let's look at a prediction (from EMECalc) of how strong echoes might be. This table assumes operation at 1296 MHz (though it's applicable at all frequencies if whatever dish is used has the same gain as shown in the table, a system noise figure of 0.3dB, a dish with an f/d ratio of 0.33 and an OK1CFC septum feed with a choke. Those numbers are for the average moon-earth distance of around 380,000km. These are the EMECalc numbers and assume your whole system is optimized and working as well as it can be made to work. You probably won't see numbers this high but you might expect to get within 1 or 2dB of them. Remember these are for average moon distance, so they could be 1dB stronger at perigee and 1 dB weaker at apogee.
| Dish Diameter | 125w | 250w | 500w |
|---|---|---|---|
| 4m (33.7dBi) | -4.3 | -1.6 | +1.4 |
| 3m (31.2dBi) | -9.5 | -6.5 | -3.4 |
| 2.4m (29.2dBi) | -13.3 | -10.3 | -7.3 |
| 1.9m (27.1dBi) | -17.3 | -14.3 | -11.3 |
An f/d of 0.33 is about optimum for echo strength with an OK1DFC type septum feed with a choke. If you go to an f/d of 0.4, echoes will be weaker by maybe -1.3dB. When the moon is closest, at perigee, the numbers will be about +1.1dB better, at apogee when the moon is further away, the numbers will be around -1.1dB worse. The numbers scale with Tx power, so 3dB more Tx power will make echoes 3dB stronger (+3dB). They also scale by 2x the dish gain, so a dish of the same f/d with 3dB more gain (twice the area) will see echoes that are +6dB stronger.
For more about the relationship between best Tx performance, best Rx performance, best echo performance, dish f/d and feed type see Dish Feed Optimization
Why Measure echoes?
Apart from basic interest in the size and shape of echoes and their relation to the physics of reflection, there are some practical reasons why EME stations might want to measure echoes. The first is that the strength of the echo is strongly related to how well the antenna is aimed at the moon. There's a "double gain" effect here. The amount of power the antenna aims at the moon depends on how accurately it is pointed, and the amount of energy received back depends on the pointing accuracy too. So if the antenna is aimed slightly off the moon and that the gain is 3dB down in the direction of the moon, the echo will be 6dB weaker. The average echo strength is a good indication on how good the antenna aiming is, but this is the average echo strength, not the strength of any single echo, which can vary by several as described next.
The strength of individual echoes can vary quite a lot, The difference between the averge power in one 2s echo and the next 2s echo can easily be several dB. This means that you may have to run for 5-10 echoes if you want to be reasonably confidant you have a good average reading. For a 1296 echo with 30dB Doppler spreading at a level of around -10dB (referenced to a 2500Hz bandwidth), it can take at least 5 echoes before you are pretty sure to be with +/- 0.5dB of the true (long term) average value. That's about 30 seconds of echo testing, so you can see that real time "peaking" of an antenna via echoes can take a little time and needs quite a few echoes. The good thing about echo testing for antenna alignment on the moon is that it can be quite sensitive to pointing accuracy due to the fact that it affects both Tx and Rx. I can quite easily see a 1 degree aiming error on 1296 with a 3m dish. That's about enough to reduce both Tx and Rx gain by about 0.5dB.
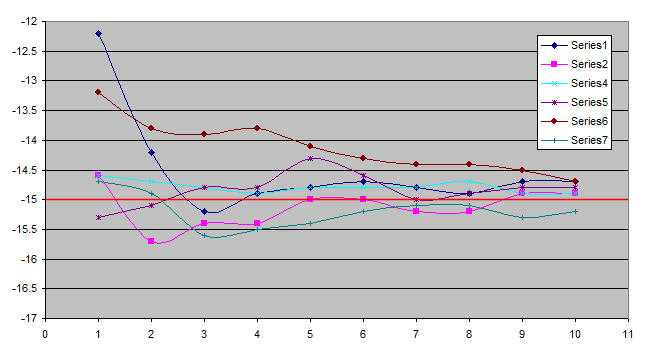
Weaker echoes may take a little longer to reach and accurate value. At 30Hz spreading and -15dB the SNR vs. number of echoes plot can look like this.
Despite this statistical variation, you can still use echo testing to see if changes to your system (new coax, adjusting feed, extending dish etc.) have make an improvement. If you are looking for changes down in the +/-0.1 dB range, you may have to average 50 echoes. If you want +/- 0.5 then maybe 10 or 20 echoes will be enough. It depends somewhat on spreading and SNR. The wider an echo is spread and the weaker it is, the more difficult it is to get reading of a given accuracy. You do, of course, have to factor the changing distance to the moon into the equation. Echoes at perigee can be 2.3dB stronger then they are at apogee simply due to the moon being closer. The sky noise behind the moon also plays a role at frequencies below 1296 MHz, as goes man-made and ground noise noise picked up by antenna side-lobes and feed-through and spillover for dish antennas. EMECalc can predict echo strength. Don't be too disappointed if your numbers indicate weaker echoes than EMECalc predicts. That's pretty much true for everyone. EMECalc is the number to try to eventually get close to, not what the average station will see.
It's assumed here that the antenna beamwidth is larger then the moon's diameter. If the beamwidth is very narrow compared to the size of the moon, then other factors can come into play that will affect echo strength. This is unlikely to be the case on 1296 (you'd need a 15m dish to even get the 1dB beamwidth down to the size of the moon) but may be true for some stations on the higher microwave bands.
Then of course there is the dreaded Faraday rotation effect which rotates the polarization of RF signals as they pass through the ionosphere (twice for echoes). If the transmission is linearly polarized the polarization of the received echo can be rotated, so the reflection will appear weaker when received at the same polarization at which is was sent. About 3dB for a 45 degrees rotation, 10-20dB (in practice) for a 90 degree rotations. That makes quantitative comparison of echo strength very difficult on 432 and lower bands. At 1296MHz, circular polarization is used, so Faraday rotation has no effect of the received signal strength and so the use of quantitative measurements is much more reliable. At 10Ghz linear polarization is commonly used, but there is no Faraday rotation of signals at that frequency, so self echoes are not Faraday rotated. The same actually applies to all bands above 1296MHz. Faraday rotation does not occur to any appreciable degree at those frequencies. On 432 and lower bands, echo strength may be a way to measure local Faraday rotation.
So although the absolute measure of echo strength can be used for system optimization, there are a lot of factors to take into account. It's not just the number shown by the software. That's just a starting point! If you measure and report echo SNR, you must also include mention of the Dgrd value form the WSJTX astronomical data window for it to be useful as a point of comparison for others (and yourself too!).